Deciphering Earnings of Big Names
[2.2024] Examining Walmart's Earnings Through a Return on Equity Lens
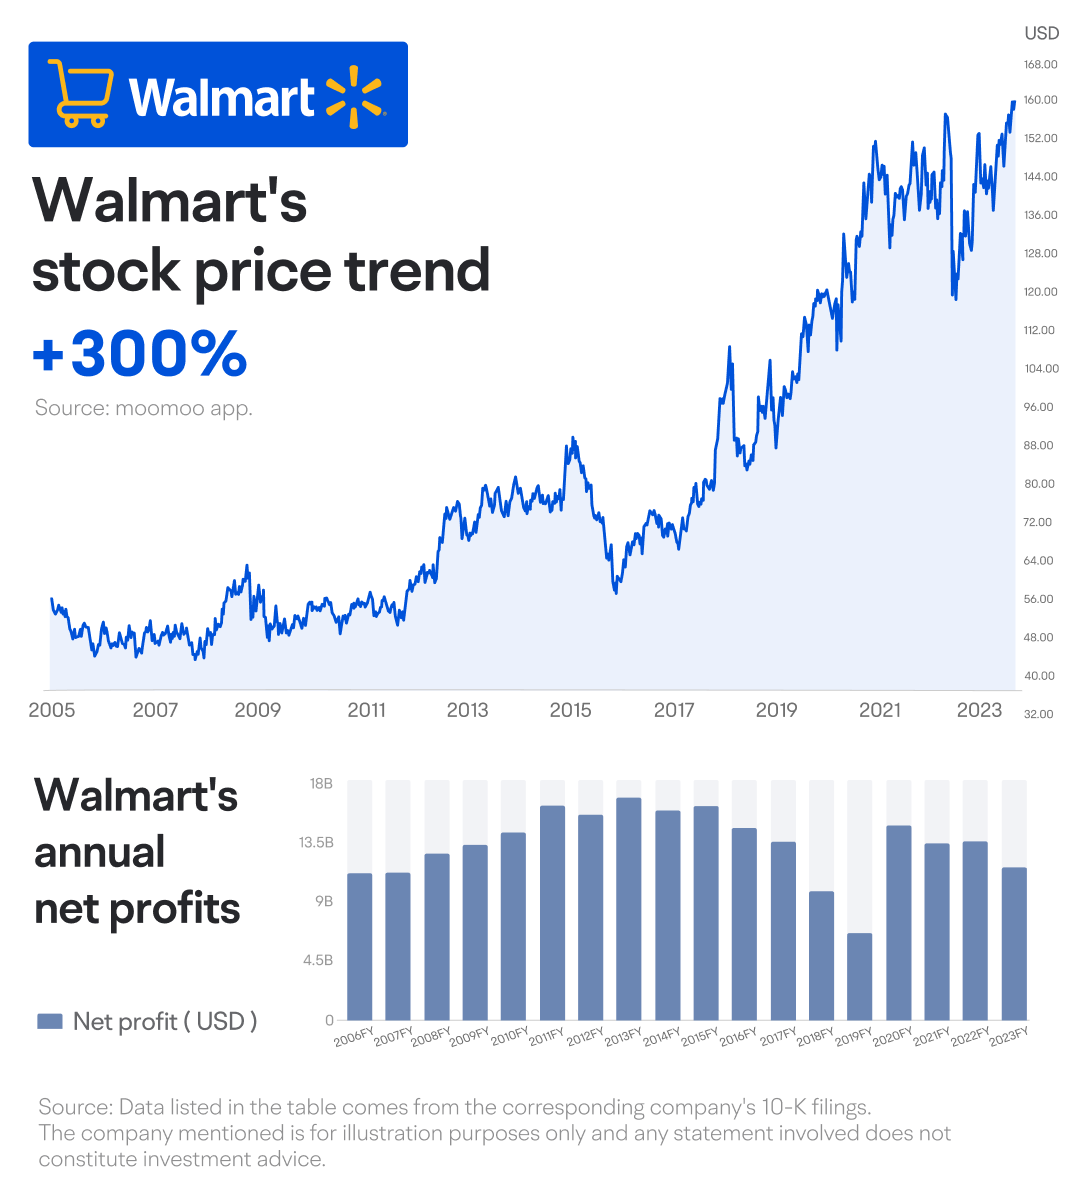
Stronger earnings usually bolster stock prices, but there are some well-known companies that do not experience earnings growth for extended periods of time, yet still see their stock prices increase.
Walmart is a great example of one of these companies. Its net profits, which barely grew from FY2006 to FY2023(FY: Fiscal year), have slid in recent years, while its share price has tripled, outperforming the S&P 500 index, which grew 2.5 times larger over the same period.
You may ask yourself, why does this happen? What drives Walmart's stock price exactly? Does its earnings report hold the key to unlocking this mystery?
Walmart will report its latest earnings on the 20th of February before the opening bell. What should we look out for in its earnings? What factors might potentially affect its stock's long-term and short-term performance, respectively?
Charlie Munger, vice chairman of Berkshire Hathaway, famously stated, "Over the long term, it's hard for a stock to earn a much better return than the business which underlies it earns."
Return on Equity (ROE) may provide insight into Walmart's better-than-the-market stock performance despite modest earnings growth.
From FY2006 to FY2023, the retail giant's average ROE hovered around 19%, far exceeding that of the S&P 500 constituents, which had an average ROE lower than 15%. This may be one of the reasons why Walmart's stock outperformed the index.

However, can Walmart maintain its ROE? How could its ROE change in the future?
We can try to answer these questions using the DuPont analysis, which breaks down a company's ROE into three components: net margin, total asset turnover ratio, and equity multiplier. Let's explore this method more closely.

1 Net margin
When analyzing a company's ROE, it's vital to ensure that the company in question has a positive net margin, which is the first component of the DuPont analysis.
Net margin reflects the ultimate profitability of a company.
In the retail industry, net margins are typically low, and Walmart, being one of the market leaders, is no exception. Over the past few decades, Walmart's net margin has decreased and currently stands at around 2% in FY2023, compared to 3.56% in FY2006.
Why does Walmart's net margin continue to decline?

By analyzing Walmart's financial reports, we can see that its gross margin has remained stable at around 24%.
Nonetheless, its operational costs have escalated as a proportion of revenue, standing at 20.8% in FY2023, compared to 20.5% in FY2006.
Considering Walmart's narrow net margin, substantial rises in operational expenses could detrimentally affect its overall profitability.

The good news is that Walmart has maintained a stable level of operating expenses since FY2017. Investors should monitor whether the company can continue to reduce its operating expense ratio and its impact on its net margin in the foreseeable future.
2 Total asset turnover ratio
The second component in the Dupont analysis formula is the total asset turnover ratio, which measures a company's operating capacity.
Given Walmart's extremely low net margin, maintaining a relatively high ROE tests the management team's ability to effectively use the company's assets to generate profits.
Among many US-listed companies, retail chains typically have higher ratios. Walmart's ratio of 2.4 times is average in the industry but significantly lower than its competitor Costco, which has a ratio of 3.7 times.

Another significant indicator that assesses a company's operational capacity is the inventory turnover ratio. Unlike the consistent total asset turnover ratio, this measure experiences fluctuations for Walmart.
This metric holds significance for retail chains as it reflects the efficiency of the company's product sales. A decline in the inventory turnover ratio could indicate sales pressure, potentially having a negative impact on the company's stock price.
A reduced inventory turnover ratio can also pull down the total asset turnover ratio, given that inventory is included in the calculation of total assets.
For example, in Q1 FY2022, Walmart's inventory turnover ratio stood at approximately 8 times, marking a 16.5% YoY (Year over Year) decrease, which subsequently lowered the total asset turnover ratio.
This raised concerns about Walmart's sales outlook, leading to a 20% drop in the stock price within three days of Walmart's earnings release.
Therefore, in Walmart's latest financial report, it's important to check for any major changes in inventory turnover ratio and to see if the total asset turnover continues its track record of stability.
3 Equity multiplier
Given Walmart's declining net margin and stable total asset turnover ratio, maintaining a high ROE requires achieving a high equity multiplier.
This appears to have helped Walmart maintain a relatively high ROE despite its sliding net margin.
From FY2006 to FY2023, the retail giant's equity multiplier increased from 2.52 times to 3.05 times.

An equity multiplier equals the average of total assets divided by the average of the company's net assets. So one possible way to boost the equity multiplier is to reduce net assets.
Walmart did this through share buybacks and dividend payments, which is a typical practice for many mature US-listed companies. These corporate actions can also return value to shareholders and provide more liquidity to the market.
From FY2006 to FY2023, Walmart's total net profit reached $243.07 billion, with share buybacks and dividend payments totaling $209.52 billion, accounting for 86% of the profit.

Nonetheless, starting from FY2015, a discrepancy has emerged between the trajectory of share buybacks and dividend payments as a percentage of net income and the average ROE.
During the period spanning FY2006 to FY2015, the average for share buybacks and dividend payments as a percentage of net income stood at 0.71, while the average ROE reached a peak of 21.4%.
However, beginning FY2016 onwards, this ratio escalated to 1.15, accompanied by a decline in the average ROE to 15.7%.

The drop in Walmart's net margin, which has outpaced the growth of share buyback and dividend payments, seems to explain why Walmart's ROE has been declining.
Moreover, it may be unsustainable for Walmart to continually repurchase shares and pay out dividends higher than its net profit.
If Walmart's net margin continues to drop, its ROE might keep going downward, potentially weighing on its share price.
This trend may be reflected in Walmart's stock price over time. Between FY2006 and FY2015, when the company's ROE was relatively high, its share price doubled, surpassing the S&P 500 index by an impressive 69% during the same period. However, when its ROE declined between FY2016 and FY2023, Walmart's share price leveled off with the index.
In conclusion
Historically, Walmart's stock performance outpaced the market index partly due to its high ROE.
The components of ROE include net margin, total asset turnover ratio, and equity multiplier.
The company's net margin has been negatively impacted by higher operating expenses, leading to a decline in its ROE over time.
Walmart's inventory turnover ratio may also have a significant impact on its short-term stock performance and total asset turnover ratio, which has remained stable over the years.
Although share buybacks and dividend payments have driven up the equity multiplier, this can not fully offset the negative effects of a declining net margin.

The S&P 500 is an unmanaged index of 500 widely held stocks. Keep in mind that individuals cannot invest directly in any index, and index performance does not include transaction costs or other fees, which will affect actual investment performance. Individual investors' results will vary. Dividends are not guaranteed and are subject to change or elimination. This content is not a research report and is not intended to serve as the basis for any investment decision. The information has been obtained from sources considered to be reliable, but we do not guarantee that the foregoing material is accurate or complete.