Deciphering Earnings of Big Names
[2.2024] Nvidia's Q4 Earnings Review and Future Outlook: Four Key Factors to Watch
Nvidia's stock has had an impressive run, surging nearly 50% this year, which has pushed its price-to-earnings (PE) ratio close to 100.
The significant rise in Nvidia's stock may, to some extent, reflect the market's anticipation of its upcoming earnings report. Nvidia is set to release its Q4 financial results for fiscal year 2024 after the US stock market closes on February 21st.
So what should we look out for in its earnings? What could move its stock price? There are four key factors to consider.
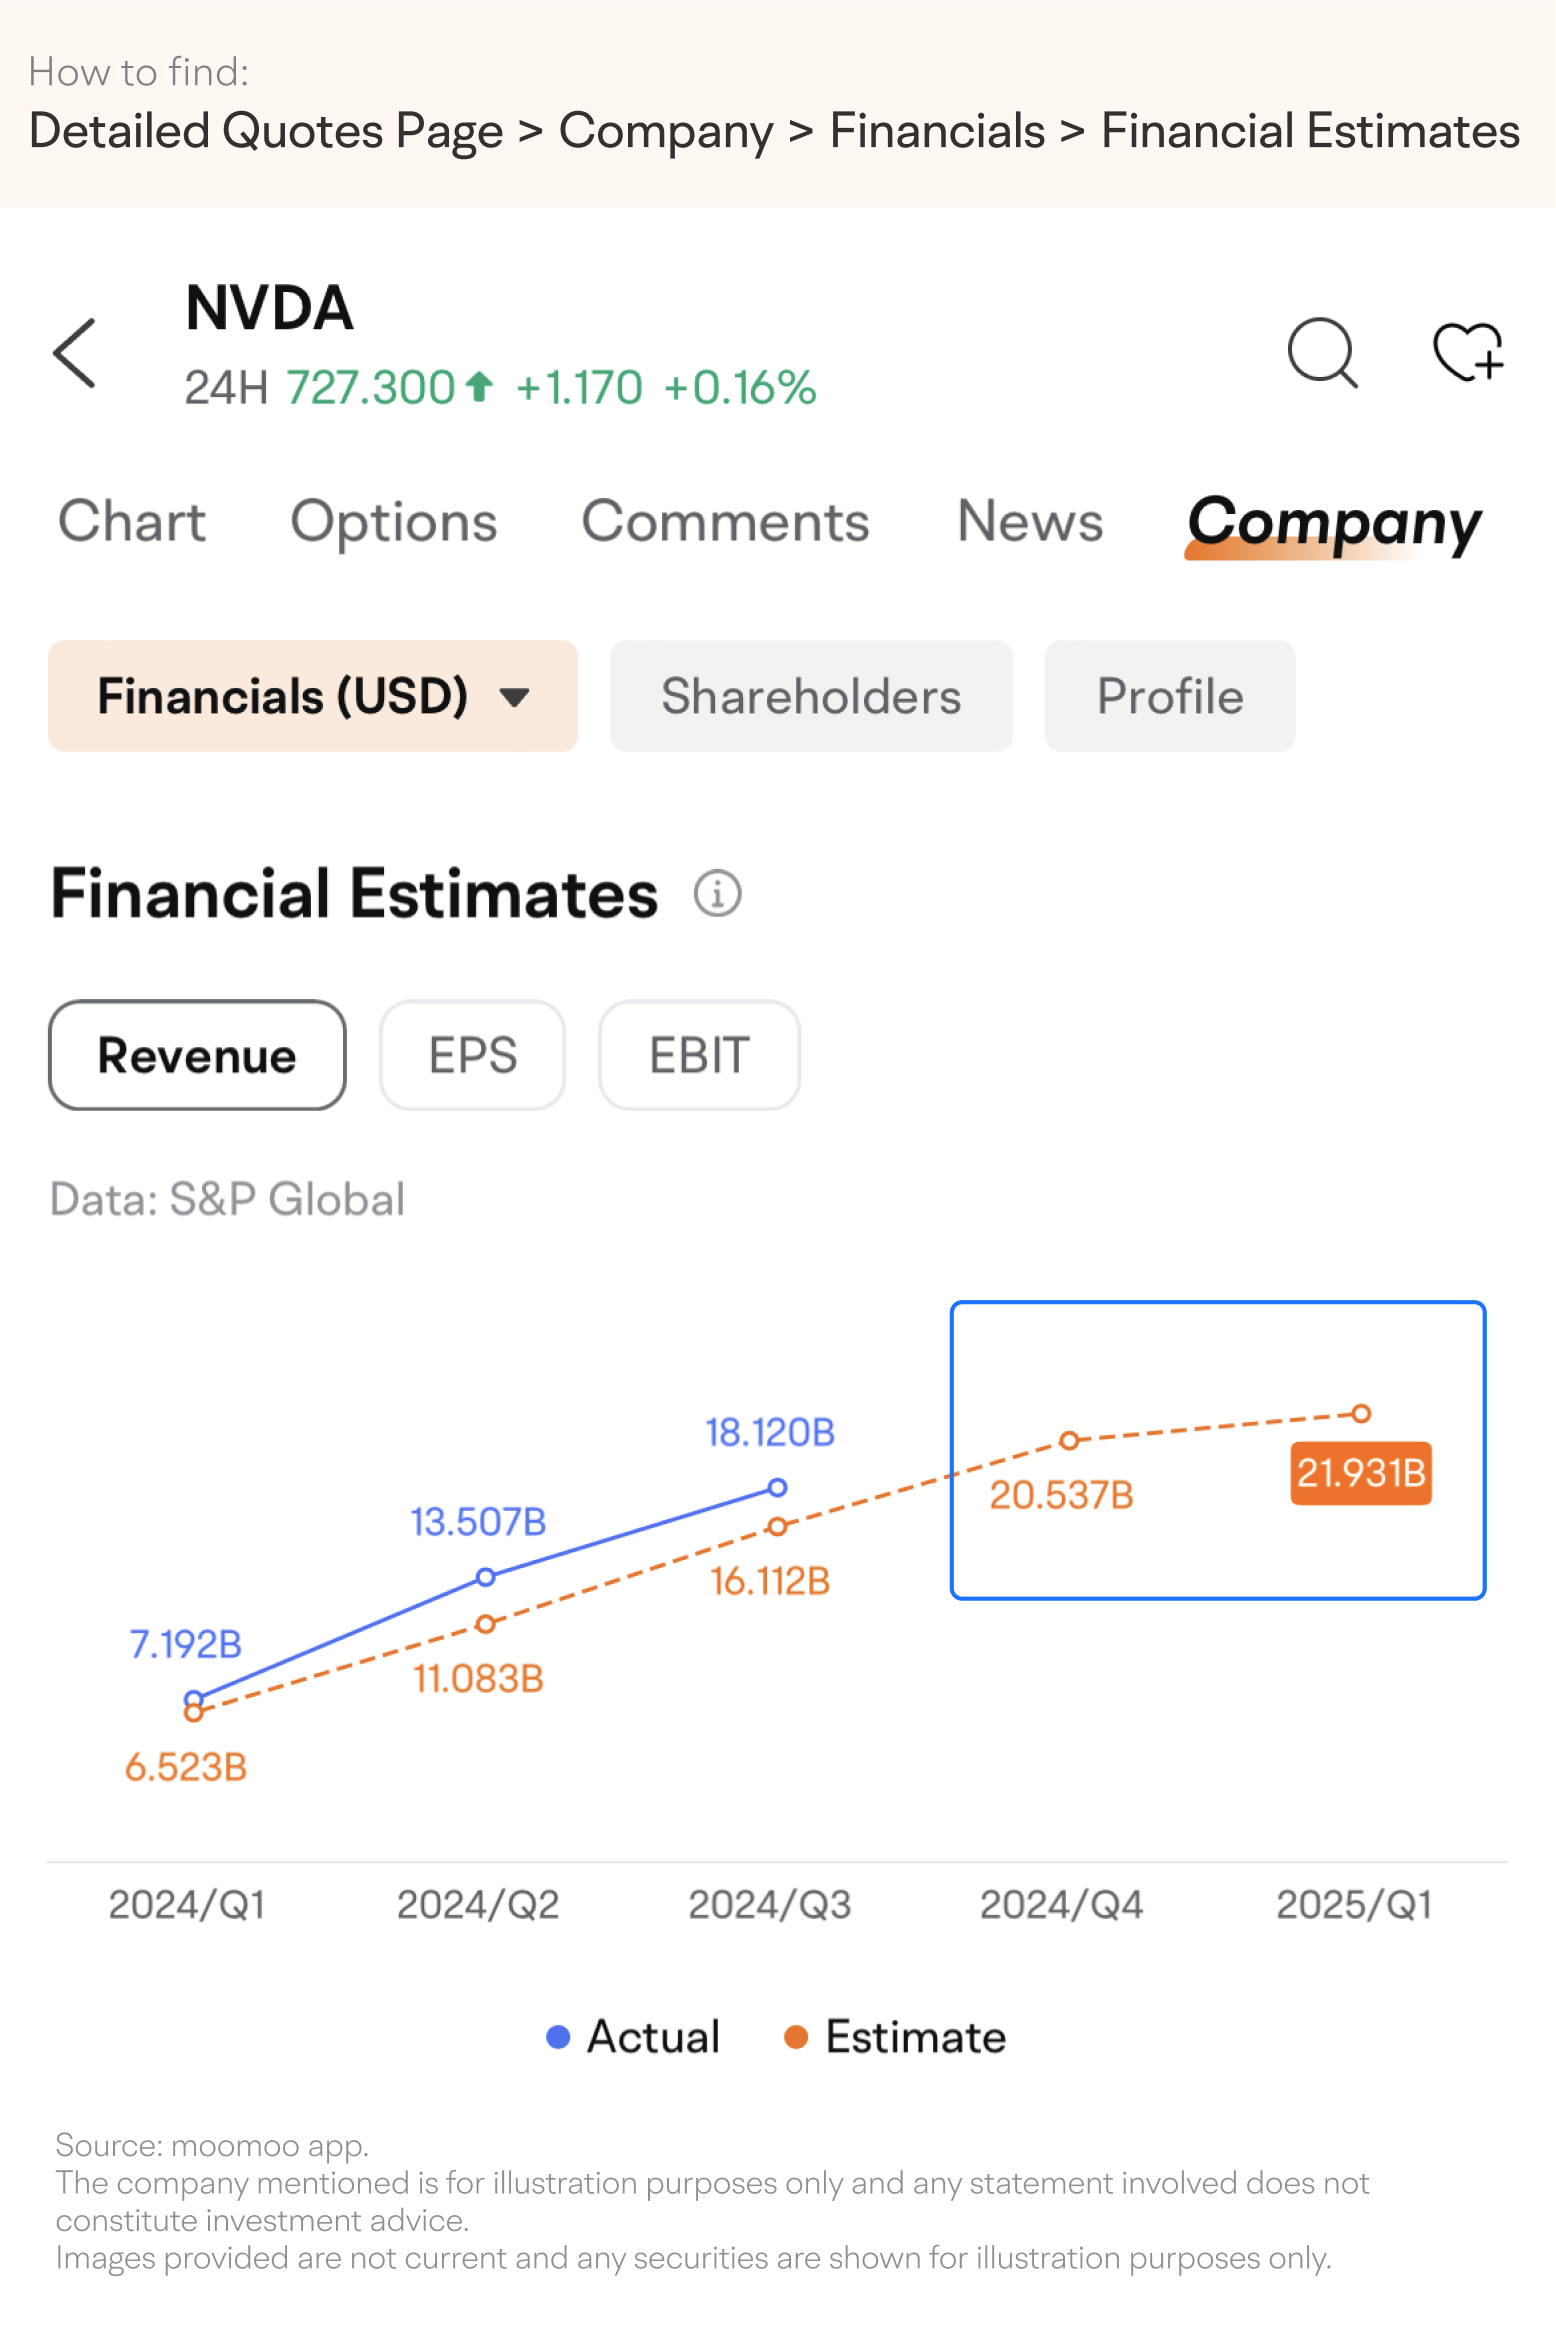
1. Comparison between actual earnings/guidance and analyst estimates
The surge in AI has driven a high demand for processors, breathing new life into the semiconductor industry that had been stagnant for the past two years.
As a leader in this space, Nvidia has exhibited the strongest rebound and the most robust financial performance in the past quarters.
As such, the gap between actual earnings and analyst estimates may have a significant impact on stock prices, and this information is readily available on moomoo.
If the actual earnings result significantly exceeds the estimate, it may drive up the short-term stock price. In contrast, if the earnings fall short of the estimate, it may weigh down on the stock price.
What if Nvidia's performance didn't exceed expectations by a large margin as expected? It may still negatively impact the stock price because investors might have already taken into consideration the high expectations. A mediocre result might not be enough to boost Nvidia's overall stock price.
In addition to actual earnings, earnings guidance from the management team is also important. Higher-than-expected guidance can be bullish for the stock price, while lower-than-expected guidance can be bearish.
For example, Nvidia's earnings report for Q3 FY2024 showed that the company exceeded its anticipated revenue of $16.1 billion with $18.1 billion, as well as an EPS of $3.71, higher than the initial estimation.
At the same time, the company also posted higher-than-expected guidance for its Q4 revenue of $20 billion.
However, after the financial report was released, the market might have deemed Nvidia's performance to be less than impressive, and the share price dropped the next day.
Therefore, for Nvidia's latest quarter, it may be important to focus on how the company's actual performance stacks up against Wall Street analysts' predictions and see if Nvidia can deliver results that meet market expectations.
2. Data center business revenue
Nvidia's data center business has been its primary growth engine, with its contribution to total revenue surging from 37% in FY2021 to a staggering 60% in Q2 FY2024.

In the first two fiscal quarters of 2024, partly due to the AI boom, the chip maker reversed its declining revenue from its data center division and posted double-digit growth both annually and sequentially.
The release of Nvidia's Q3 earnings report appears to have further tested market demand for its chips, with investors likely looking for signs of continued growth in their critical segment.
The Q3 report revealed that its data center business revenue reached US$1.45 billion, marking a significant year-over-year increase of 278.7% and a quarter-over-quarter increase of 40.6%.
This growth has become the primary driver of Nvidia's total revenue, accounting for a historical high of 80.1%.
Going forward, investors may keep a close eye on the potential further acceleration of the data center business's growth in future financial reports.
3. Inventory
Inventory can be another important indicator for the cyclical chip-making industry. Generally, when demand drops, inventory levels increase, creating pressure on sales and potentially weighing on the stock price. In contrast, when demand rises, inventory levels usually decline, and sales boost.
One indicator to measure inventory changes can be by dividing inventory measured in dollars by revenue. The higher the indicator, the higher the relative inventory level, and the greater the pressure it has on sales.
For example, starting from Q4 FY2022, Nvidia's inventory-to-revenue ratio consistently increased, which coincided with the reversal of the stock price trend.

Nvidia gained momentum during Q1-Q3 FY2024, and this significantly reduced its inventory levels. The company's inventory-to-revenue ratio dropped from 85.3% in Q4 FY2023 to a historic low of 26.4% in Q3 FY2024. This may be a positive sign for Nvidia, and we can continue to monitor this ratio for the upcoming financial reports.
4.Profitability
The company's gross margin has been upward, reaching 70% in Q2 FY2024 and further increasing to 74% in Q3 FY2024.

Net margin growth also accelerated, hitting a historical high of 51% for Q3 after reaching 45.8% in Q2 FY2024. Going forward, we may continue to watch whether Nvidia can maintain its high net margin levels.
To summarize, we may focus on the following four key aspects of Nvidia's earnings report in the coming quarters:
Discrepancies between actual results or guidance and analyst estimates could cause short-term price fluctuations.
Their data center's revenue growth, as it has become the company's core business.
Inventory levels, particularly the ability to keep the inventory-to-revenue ratio as low as possible.
Profitability, with an emphasis on maintaining high gross and net margins.
However, Nvidia's trillion-dollar valuation might be a cause for concern. Additionally, investors should be aware of the downside risk of the semiconductor industry.
